Others: Power Analysis
- Power Analysis I: Basic Concept
- Power Analysis II: Example
- MATLAB: sampsizepwr
* Zihan Chen
* 2015-03-29
Contents
Power Analysis (T-Test) MATLAB
- Based on MATLAB doc: * http://www.mathworks.com/help/stats/sampsizepwr.html
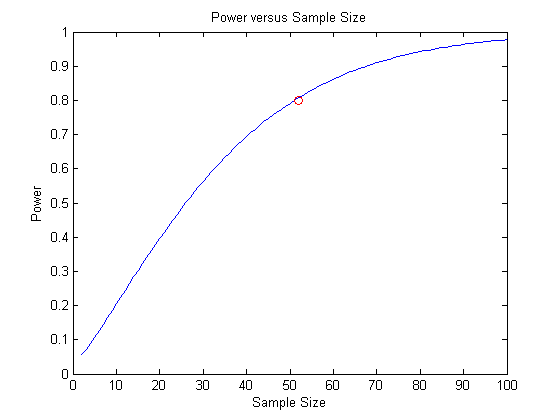
clc; clear; close all;

% data
mu = 100;   % H0 mu = 100 ml
sigma = 5;    % H0 std = 5 ml
muHa = 102;  % Ha mu = 102 ml

% Required Sample Size
p0 = [mu sigma];
p1 = muHa;
nout = sampsizepwr('t', p0, p1, 0.80);

% Power v.s. Sample Size
nn = 1:100;
pwrout = sampsizepwr('t',p0, p1, [], nn);

disp(['nout = ', num2str(nout)]);
figure;
plot(nn,pwrout,'b-',nout,0.8,'ro')
title('Power versus Sample Size')
xlabel('Sample Size')
ylabel('Power')
nout = 52
Power Analysis (T-Test) MATLAB
Based on Power Analysis Example https://youtu.be/fRm2dEWSJrk
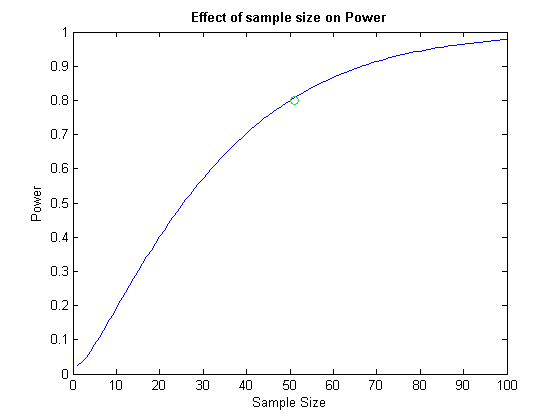
clc;
alpha = 0.05;
power = zeros(1,100);
for dof = 1:100;
    tc = tinv(1-alpha/2, dof);  % t critical
    xc = tc * (sigma/sqrt(dof+1)) + mu;

    beta = tcdf((xc - muHa) / (sigma/sqrt(dof+1)), dof);
    power(dof) = 1 - beta;
end

% nout
noutm = find(power>0.8,1);
disp(['nout = ', num2str(nout)]);

% plot
dof = 1:100;
figure; plot(dof, power, noutm,0.8,'go');
xlabel('Sample Size'); ylabel('Power');
title('Effect of sample size on Power', 'FontWeight', 'bold');
nout = 52